box_plot
Box plot
Intuition
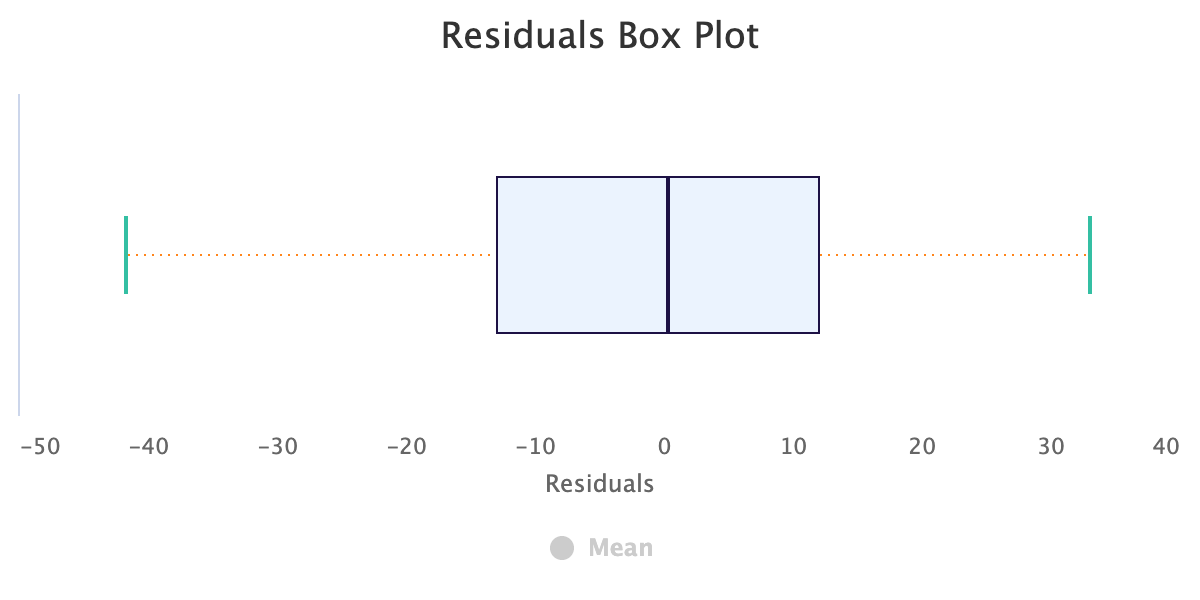
What is the residual box plot?
The boxplot shows the difference between the actual and fitted values. In a boxplot, outliers are denoted with an asterisk. The bottom whisker extends to the lowest value that is not an outlier and the upper whisker extends to the highest value that is not an outlier. The box represents the middle 50% of observations with the lower end of the box at the 25th percentile (i.e., Q1) and the upper end of the box at the 75th percentile (i.e., Q3). The line in the middle of the box represents the median.
Five number summary:
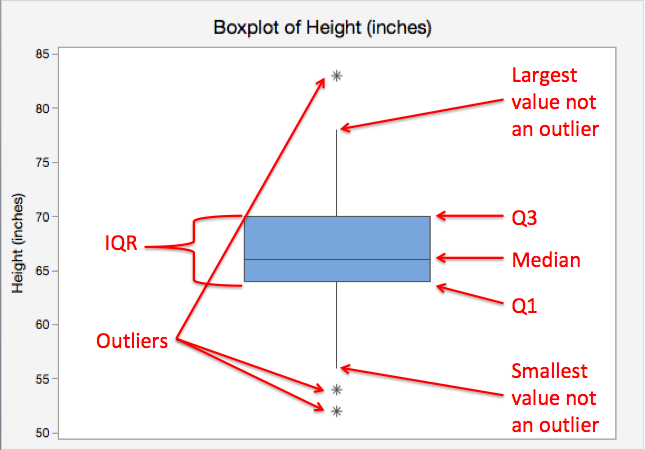
The below five values can be used to construct a graph known as a boxplot. In other words, these Five numbers are used to describe some of the key features of distribution and we can compute the range and interquartile range.
-
Minimum: Smallest value
-
First quartile (Q1): 25th percentile (value that separates the bottom 25% of the distribution from the top 75%)
-
Median: Middle value (50th percentile)
-
Third quartile (Q3): 75th percentile (value that separates the bottom 75% of the distribution from the top 25%)
-
Maximum: Largest value
Range: The difference between the maximum and minimum values.
Range = Maximum - Minimum
Interquartile range (IQR): The IQR describes the middle 50% of values when ordered from lowest to highest. The difference between the first and third quartiles.
IQR = Q3 - Q1