Data Viewer
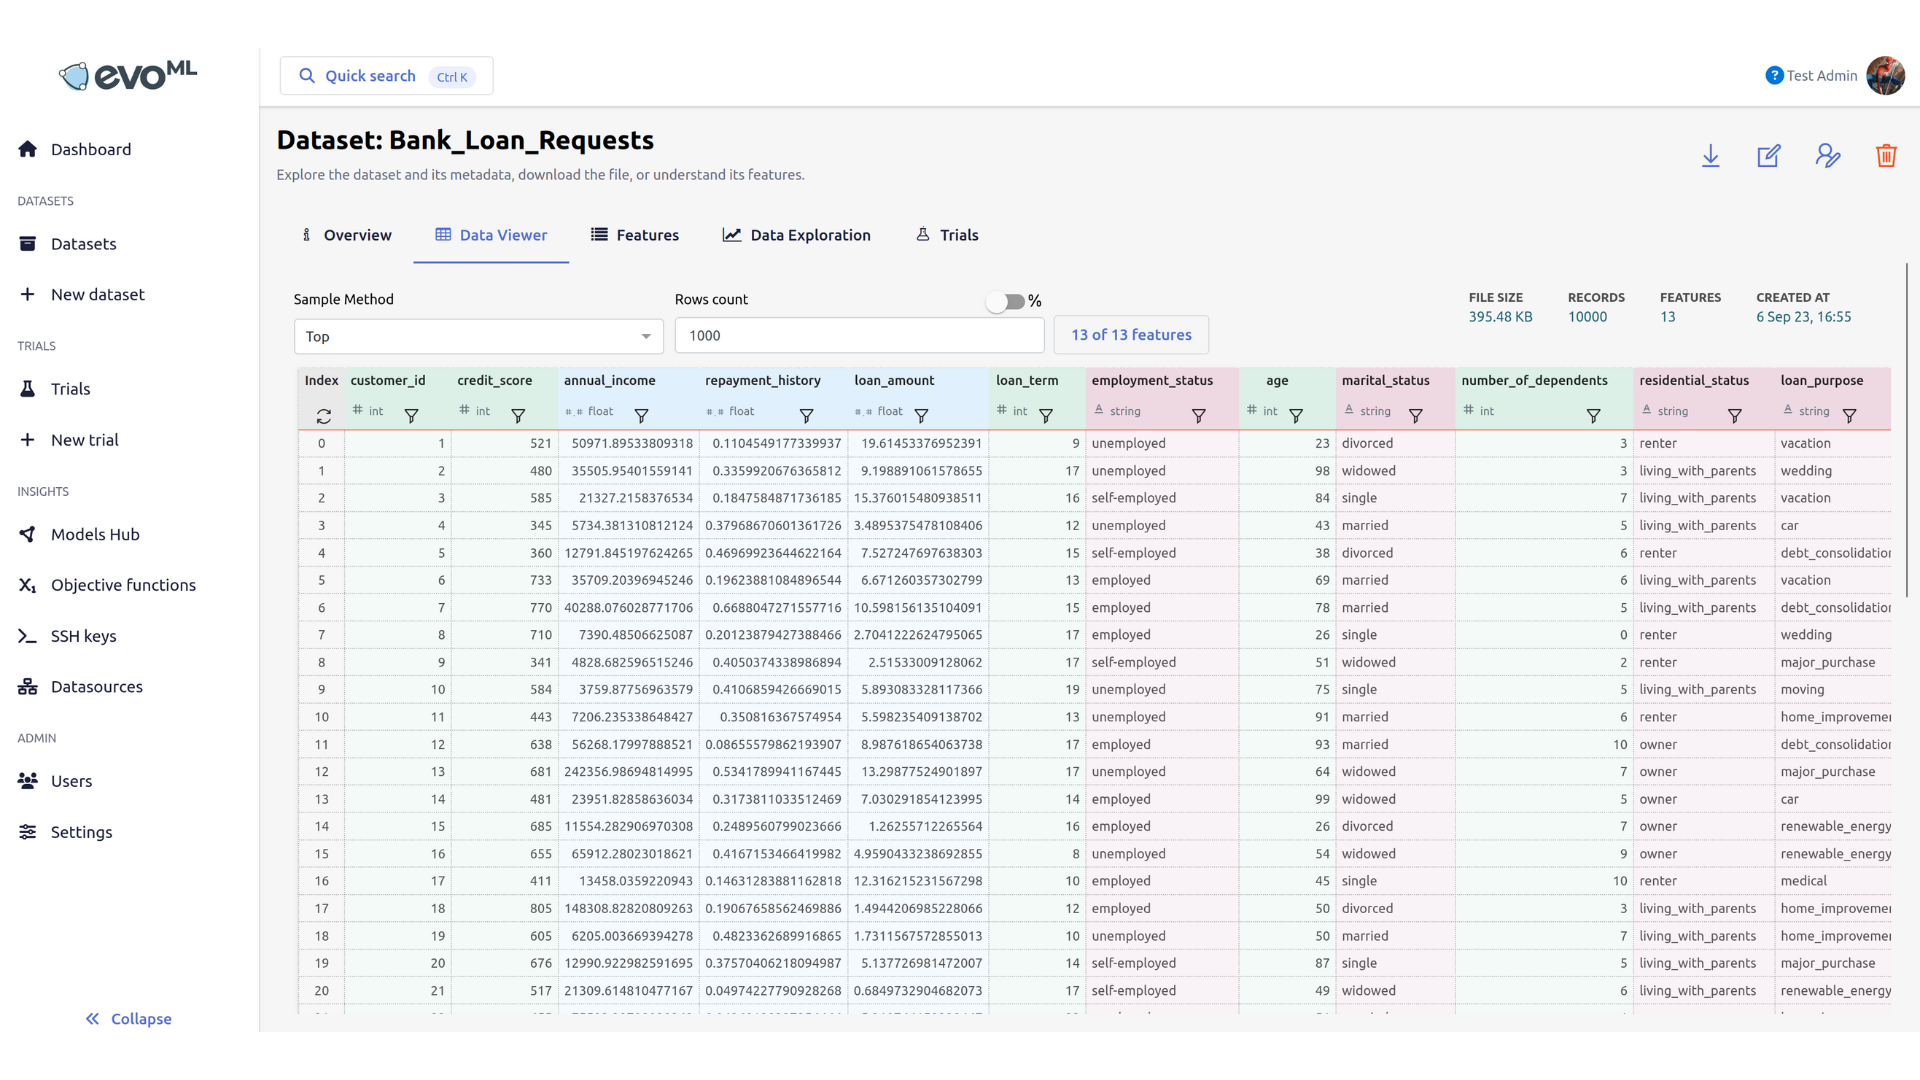
The Data Viewer is a crucial component of the platform that provides users with a comprehensive and interactive view of their dataset. It offers a detailed, tabular representation of data records, allowing users to explore and understand their data quickly and efficiently.
Core Features
Data Display
- Default View: Initially displays the top 1000 rows of the dataset
- Provides a complete snapshot of the dataset's contents
- Allows immediate visual inspection of data structure and content
Visual Data Type Representation
- Columns are color-coded to represent different data types
- Color-coding provides instant visual understanding of variable types
- Color scheme includes:
- Pink: String/Categorical variables
- Green: Integer variables
- Blue: Float/Decimal variables
Sampling Options
-
Sample Method: Enables selection of different data sampling techniques:
- Top: Selects rows from the beginning of the dataset
- Bottom: Selects rows from the end of the dataset
- Random: Randomly selects rows across the entire dataset
- Stratified Random: Ensures representation across predefined categories
-
Rows selection: Allows dynamic adjustment of the number of rows displayed. Possible configurations:
- Fixed number of rows
- Percentage of total dataset
Sample Saving and Reuse
The Data Viewer provides functionality to save a specific sample of your dataset for future use or further analysis.