Correlation Matrix
The correlation matrix offers a detailed overview of the relationships between variables in a dataset. It is an essential tool typically used during the Exploratory Data Analysis (EDA) phase to inform downstream analysis and model development.

Purpose
The correlation matrix displays the correlation coefficients for every pair of variables, enabling users to:
- Detect multicollinearity: Identify variables with high correlations to address redundancy in predictive models.
- Feature Selection: Identify the most relevant variables for analysis by focusing on those with significant correlations.
- Data Quality Checks: Ensure expected relationships between variables align with domain knowledge.
How to Use
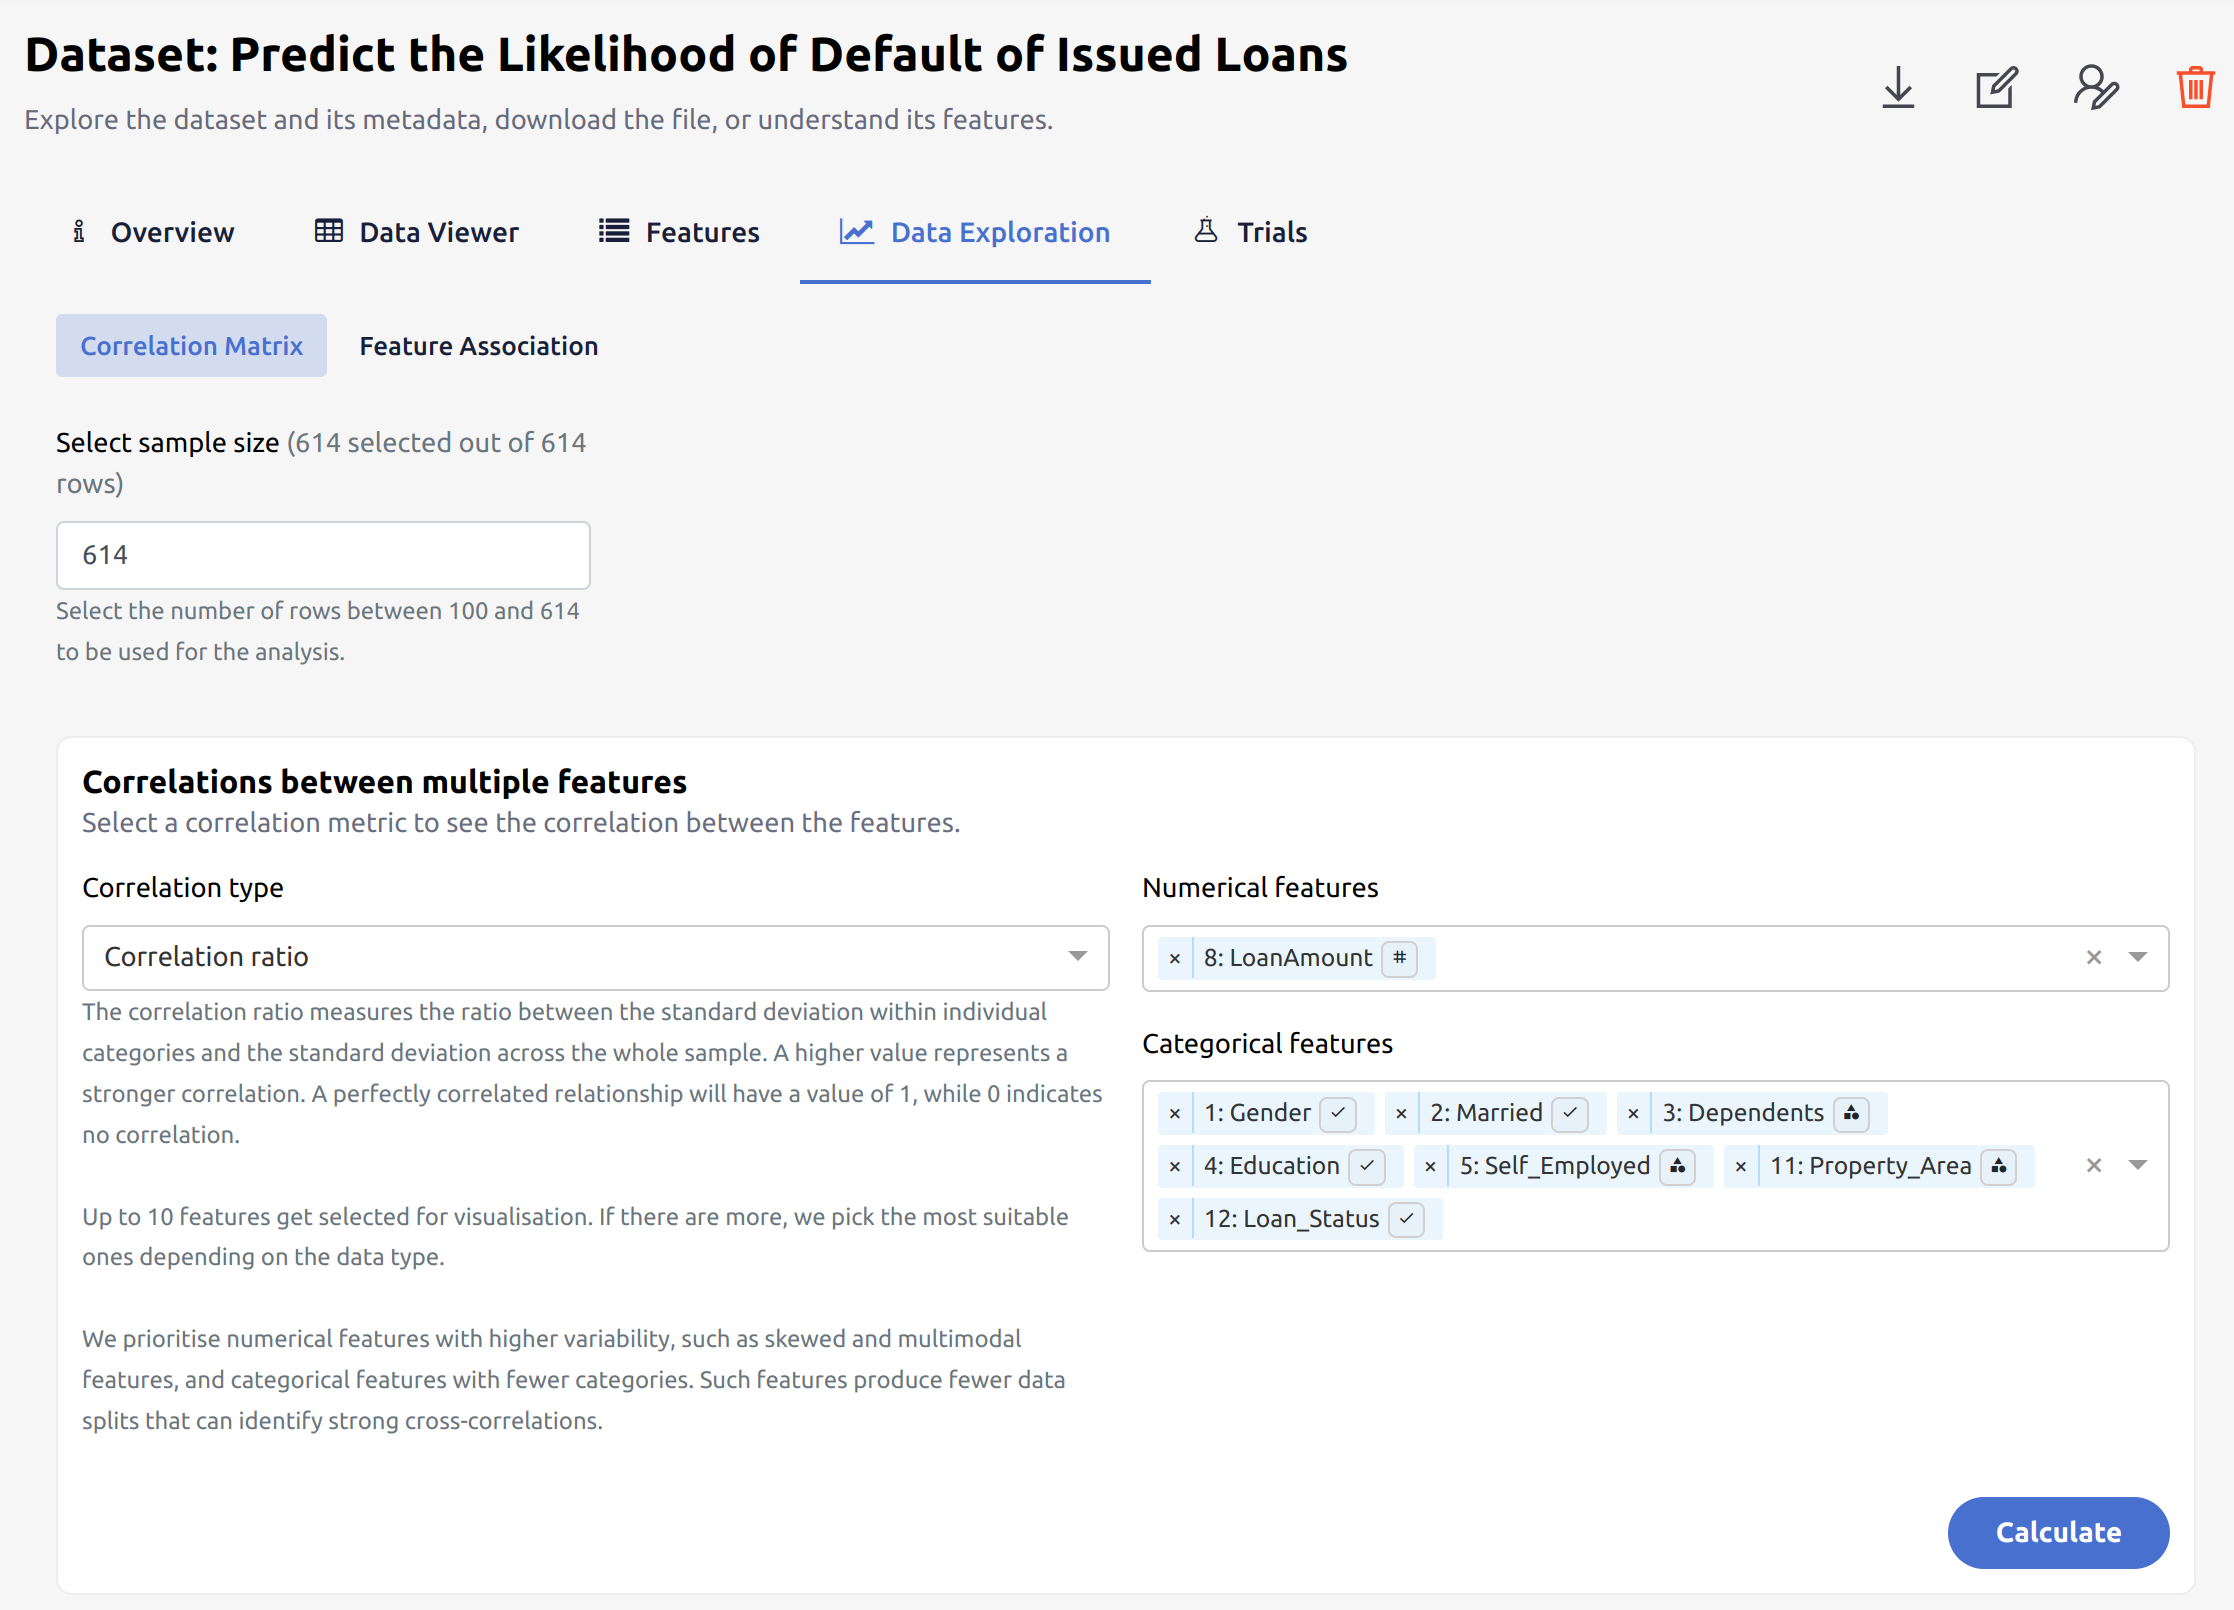
Based on the correlation metric selected, evoML may disable the type of features you can choose to compare. This is the reason for either of the dropdown menus to appear restricted.
-
Select Correlation Type. Users can specify from a range of correlation methods to suit their analysis needs:
-
Select features, these are separated in Numeric Features and Categorical Features.
-
Calculate: Click the "Calculate" button to generate data visualizations and metrics for the selected features.
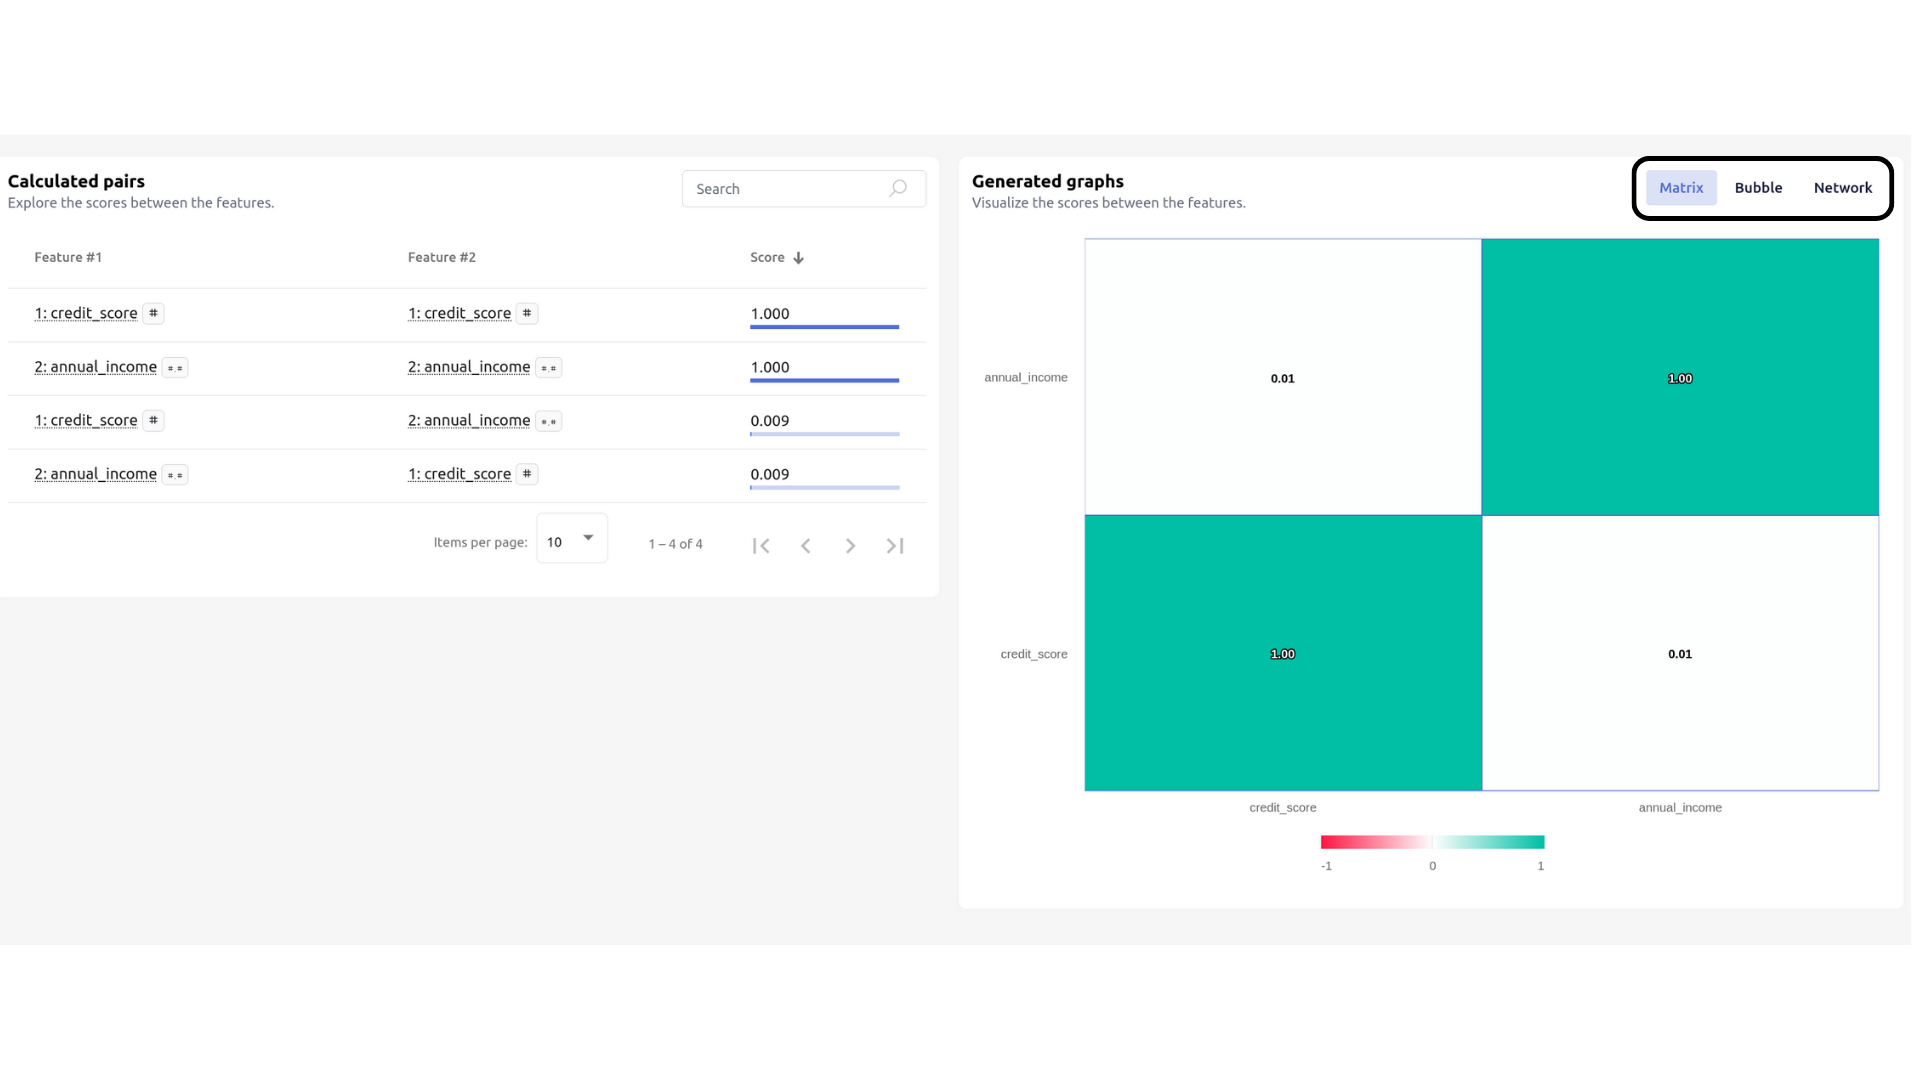
- Scores are visually represented using:
- Matrix: a grid highlighting relationships
- Bubble chart: a compact and intuitive representation
- Network diagram:

- Color intensity/ shading: highlights the strength of the correlation, stronger relationships appear more pronounced.
- Scores are visually represented using: