Feature Association
Feature Association is a powerful tool that enables you to explore and understand the relationships between any two selected features in your dataset. This functionality provides valuable insights into your data, helping you make informed decisions in your analysis and modeling processes.
Purpose
The Feature Association tool provides various visualizations and statistical metrics to help you understand the relationship between the selected features. These may include:
- Bar chart
- Scatter plots
- Correlation coefficients
- Heatmaps
- Box plots
For a comprehensive guide on interpreting these visualizations, please refer to our Resources subsection.
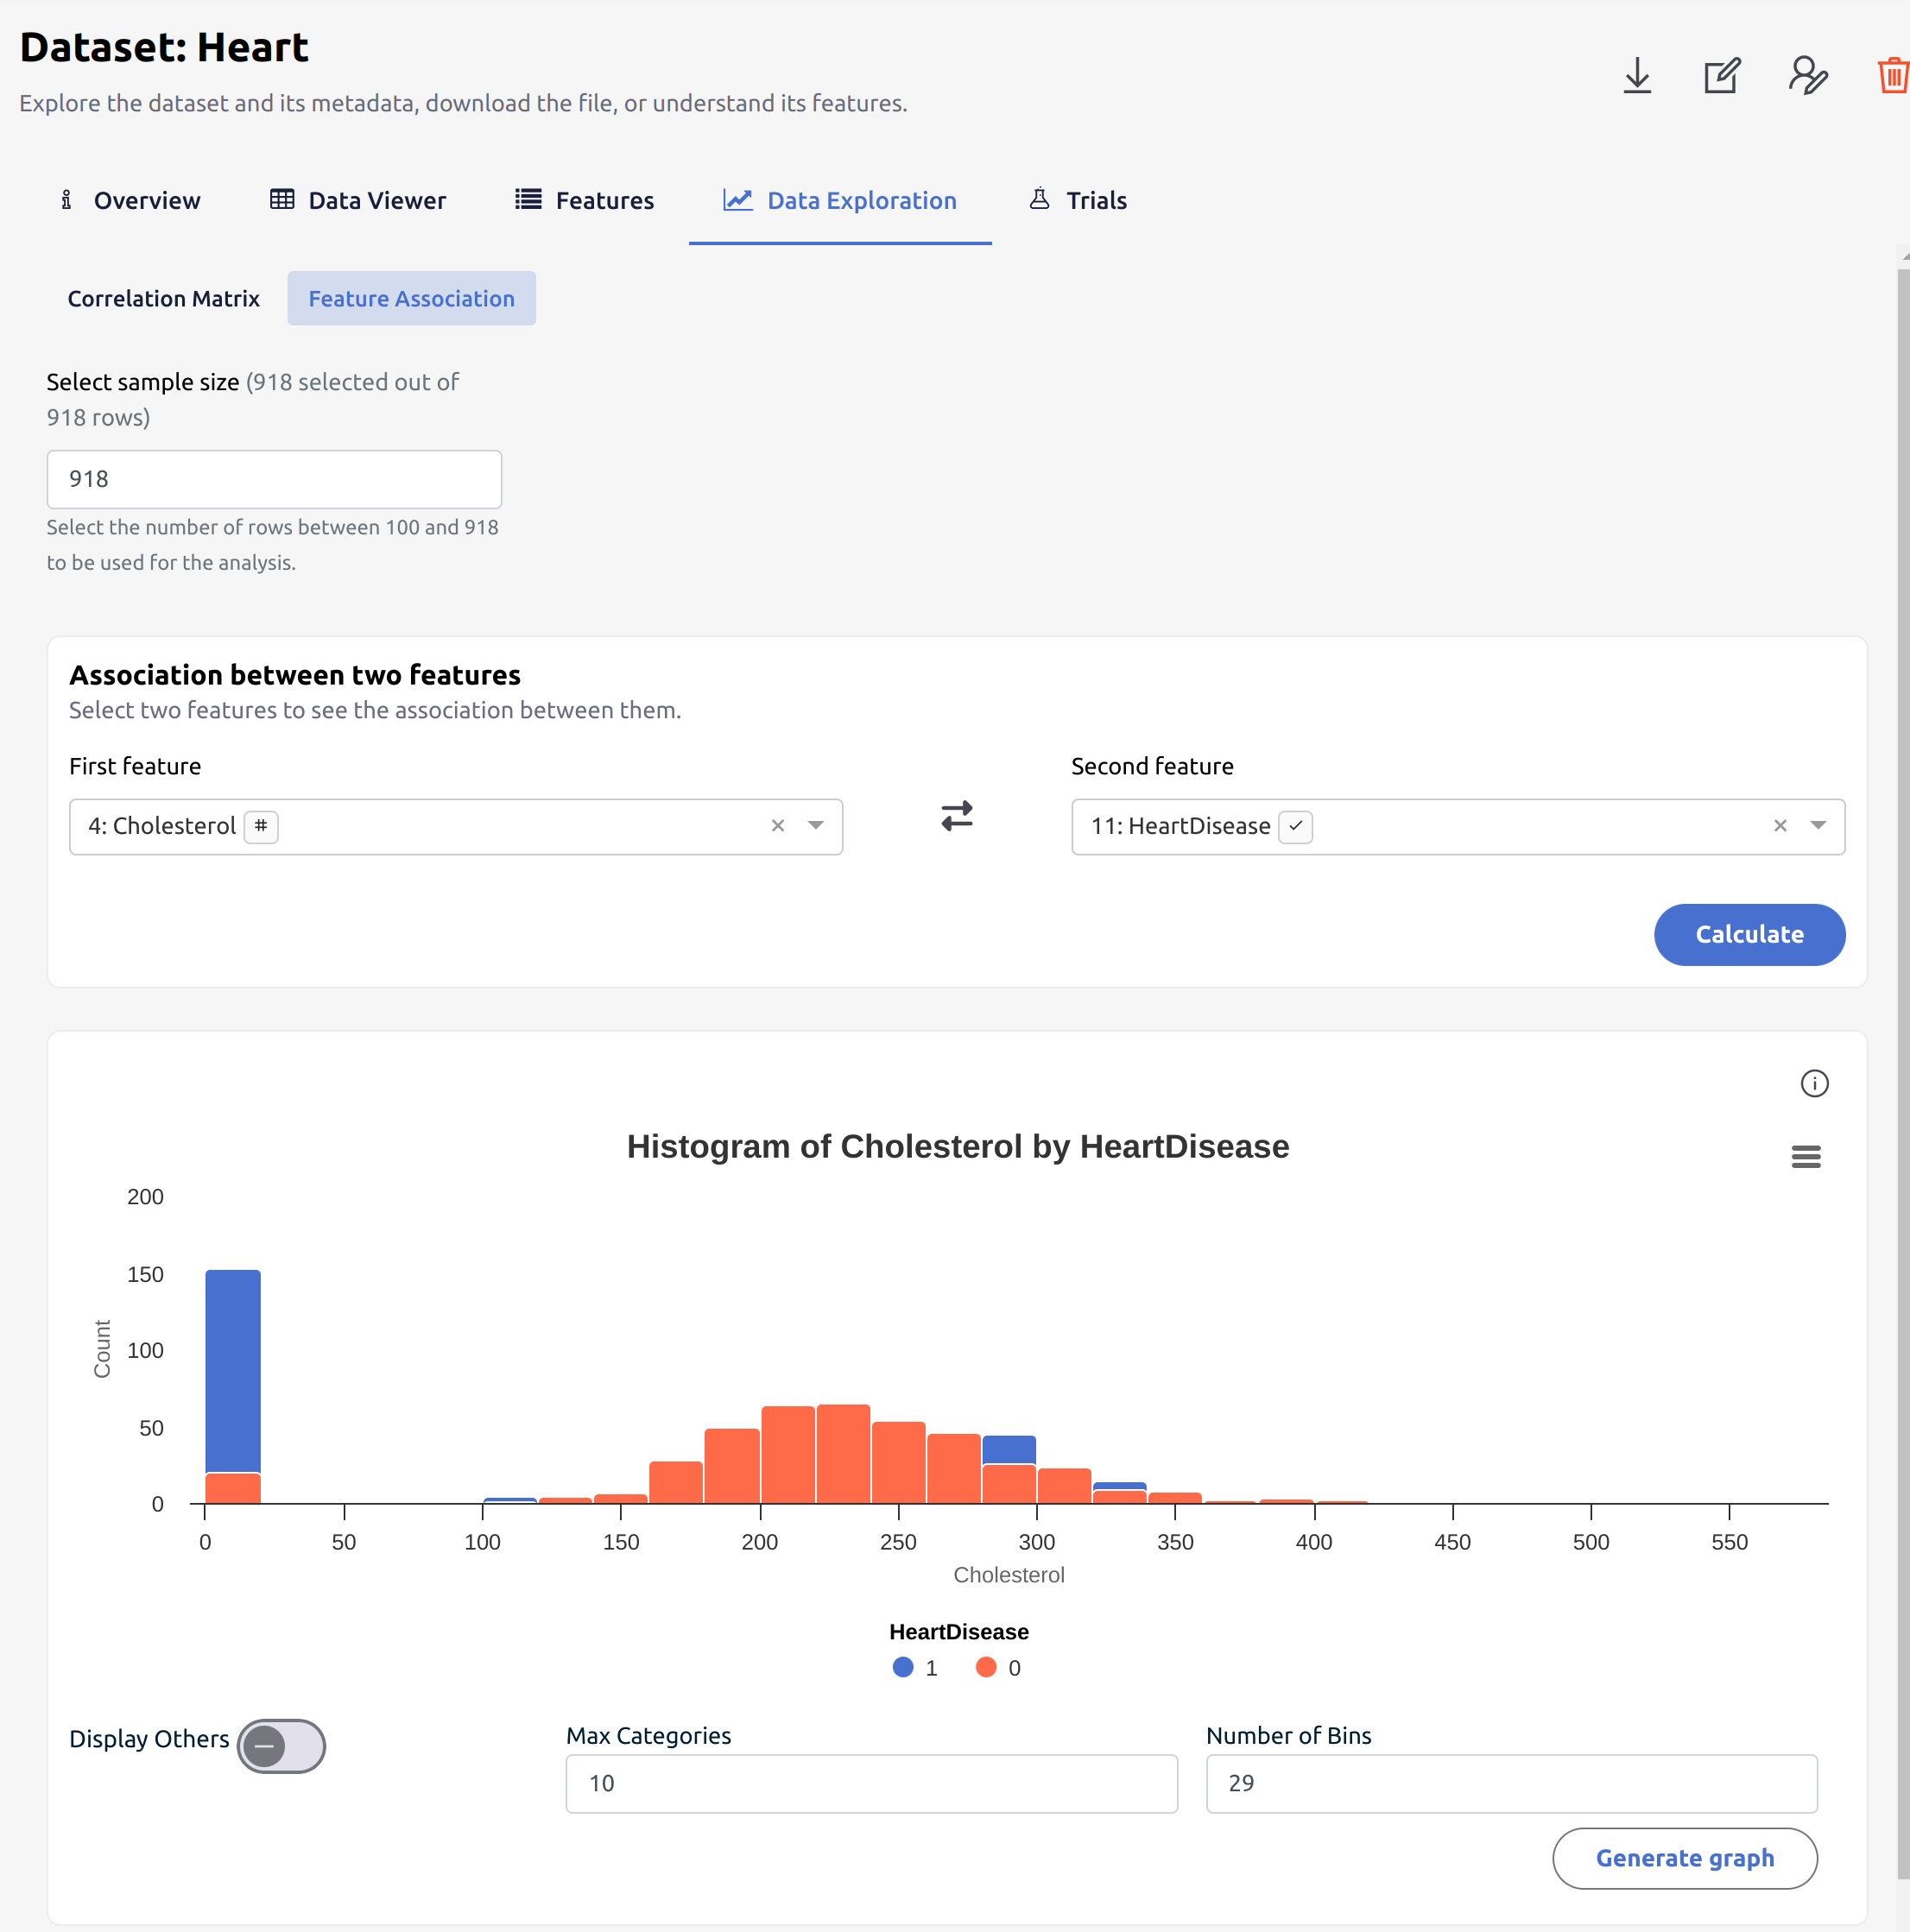
How to Use
- Select Features: Use the drop-down menus to choose the two features you want to compare.
- Calculate: Click the "Calculate" button to generate data visualizations and metrics for the selected features.
Advanced Insights
To deepen your understanding of correlation measures, we recommend reading:
- Four Methods to Statistically Measure Your Data Correlation. This article provides valuable information on different statistical approaches to measuring data correlation.
- Additional Reading