Prediction Plot
This is an example from evoML for a trial created to develop a model to predict house sale prices.
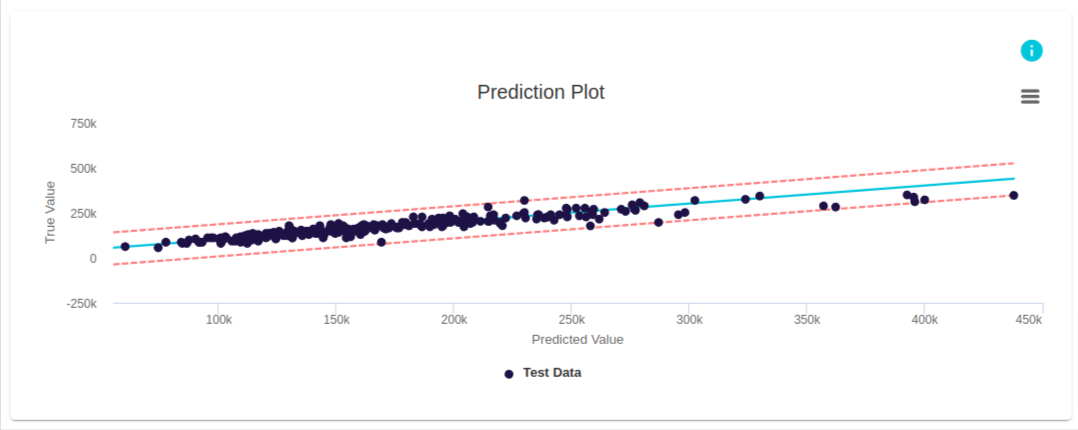
In this plot, the predicted values are shown on the x-axis, and the true values are displayed on the y-axis. Each point represents an individual observation, where the x-coordinate is the model's predicted value and the y-coordinate is the actual (true) value.
For example, in the first data point on the plot, the model predicted the house price as 55,982.21, while the true value is 60,000. This discrepancy illustrates how the predicted and true values may differ, indicating areas where the model might need improvement.
Similar to a residual plot, the closer the true value points are to the blue line (regression line), the better the model's accuracy.
Intuition
What is the Prediction Plot:
Linear regression is an approach for modeling the relationship between two variables: a dependent variable and an independent variable. It consists of finding the best-fitting straight line through the points. This line is known as the regression line.
The method of least squares is used to determine the line of best fit by minimizing the sum of squared differences between each observation's actual y-value and its predicted y-value.

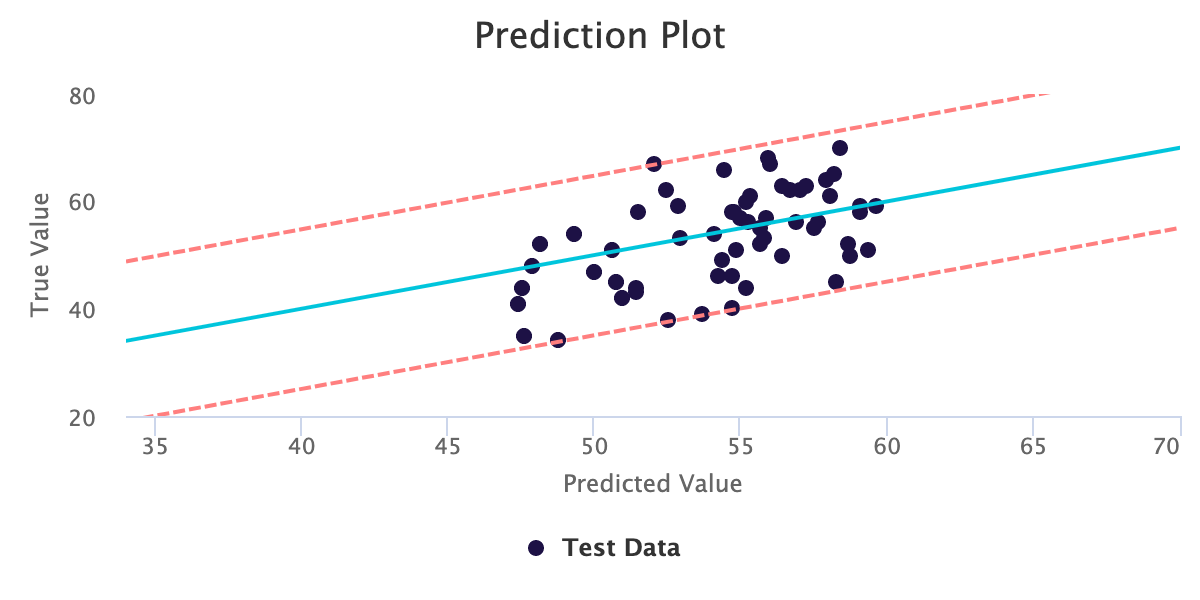
The blue diagonal line in the figure below is the regression line, which represents the predicted value on the x-axis for each possible true value (y). Thus, the prediction plot shows two parameters:
- Predicted Values
- True Values
Interpreting the Prediction Plot
The reference line allows for residual analysis. If the data are independently and identically distributed, we expect the model's predictions to match the true values closely. By comparing the reference line with the points, we can evaluate the model's performance.
- Clusters of points above or below the line suggest bias.
- Non-uniform dispersion along parts of the line indicates inadequate feature analysis.
- A random distribution of points along the reference line indicates an unbiased model with appropriate assumptions about the true distribution.