Residual plot
Intuition
What are residuals?
The model's residuals refer to the difference in value between the model's predicted values and the actual values of a particular output. The residual plot indicates two parameters:
- Predicted Values
- Residuals
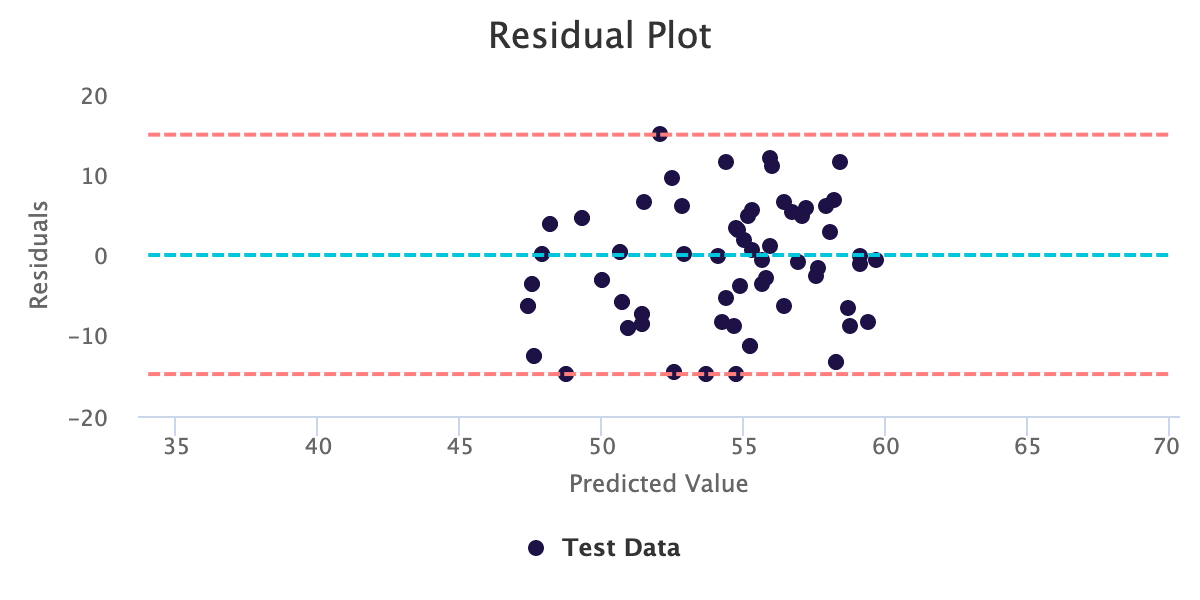
The red color lines indicate the upper and lower boundaries of residual points, respectively. In addition, the blue line shows the “0“ line.
How do you determine whether the residuals are random in regression analysis? It's pretty simple; just check that they are randomly scattered around zero for the entire range of fitted values. When the center of the residual on zero, they indicate that the model's predictions aren't systematically too high or low. Regression also assumes that the residuals follow a normal distribution and that the degree of scattering is the same for all fitted values.
Residuals should look like this:

Not these ones:


evoML example
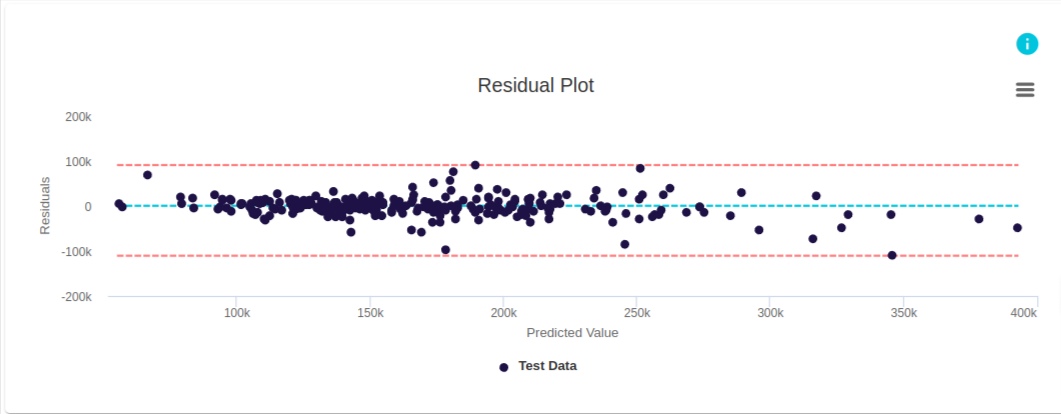
This is an example from evoML for a trial created to develop a model to predict sale prices of houses.
In this figure, predicted values are given in the x-axis. Residuals (difference between actual value and predicted value) are given in the y-axis. For a given predicted value, the plot shows how much the actual value deviated from the predicted value. For example, according to data in evoML, for the first datapoint in the plot the predicted value is 55,982.21. The residual value is 4,017.79. This shows that while the model predicted house price at 55,982.21, this is in fact 4,017.79 lower than the actual price point.
For this plot, we see that residuals are randomly scattered above and below the zero line, indicating that the model’s predictions are not systematically too high or too low. The closer the plots are to the zero line, the better the model’s predictions are.