Product Classification
Overview
This notebook demonstrates how to use evoML to build a predictive model using text embeddings for product category classification using the PriceRunner dataset. The dataset contains product listings from various merchants, and we'll focus on predicting the correct category for each product based on its title. In this notebook we will:
- Explore the data
- Upload training data to evoML
- Run a trial to build predictive models
- Build and evaluate the best model on the holdout set
- Examine some edge cases to understand model behavior
This notebook can also be viewed at https://nbviewer.org/url/docs.evoml.ai/notebooks/product-classification.ipynb.
Dataset
The PriceRunner dataset contains 35,311 product offers across 10 categories from 306 different merchants. Each product has features including its title, merchant information, and category labels. The dataset can be found here: https://archive.ics.uci.edu/dataset/837/product+classification+and+clustering
Dependencies
turintech-evoml-clientpandasnumpymatplotlibseaborn
import pandas as pd
import matplotlib.pyplot as plt
import seaborn as sns
from typing import Final
from sklearn.model_selection import train_test_split

import evoml_client as ec
from evoml_client.trial_conf_models import (
    BudgetMode,
    HoldoutOptions,
    ValidationMethod,
    ValidationMethodOptions
)
Credentials
To connect to evoML and upload the dataset, you will need:
- A URL for the evoML platform
- Your evoML username and password
API_URL: Final[str] = "https://evoml.ai"
EVOML_USERNAME: Final[str] = ""
EVOML_PASSWORD: Final[str] = ""

# Connect to evoML platform
ec.init(base_url=API_URL, username=EVOML_USERNAME, password=EVOML_PASSWORD)
Data Preparation
Loading and Splitting the Data
We begin by loading the PriceRunner dataset and preparing it for analysis. We'll create a holdout set that won't be used during model training for final evaluation.
# Load dataset
data = pd.read_csv("pricerunner_aggregate.csv")
# Replace spaces with underscores in all column names
data.columns = data.columns.str.replace(' ', '_')

# Set target column and features
target_column = "Category_Label"
training_columns = ['Product_Title', target_column]

# Create holdout set (20% of data)
train_data, holdout_data = train_test_split(
    data[training_columns],
    test_size=0.2,
    random_state=42,
    stratify=data[target_column]
)
Exploratory Data Analysis
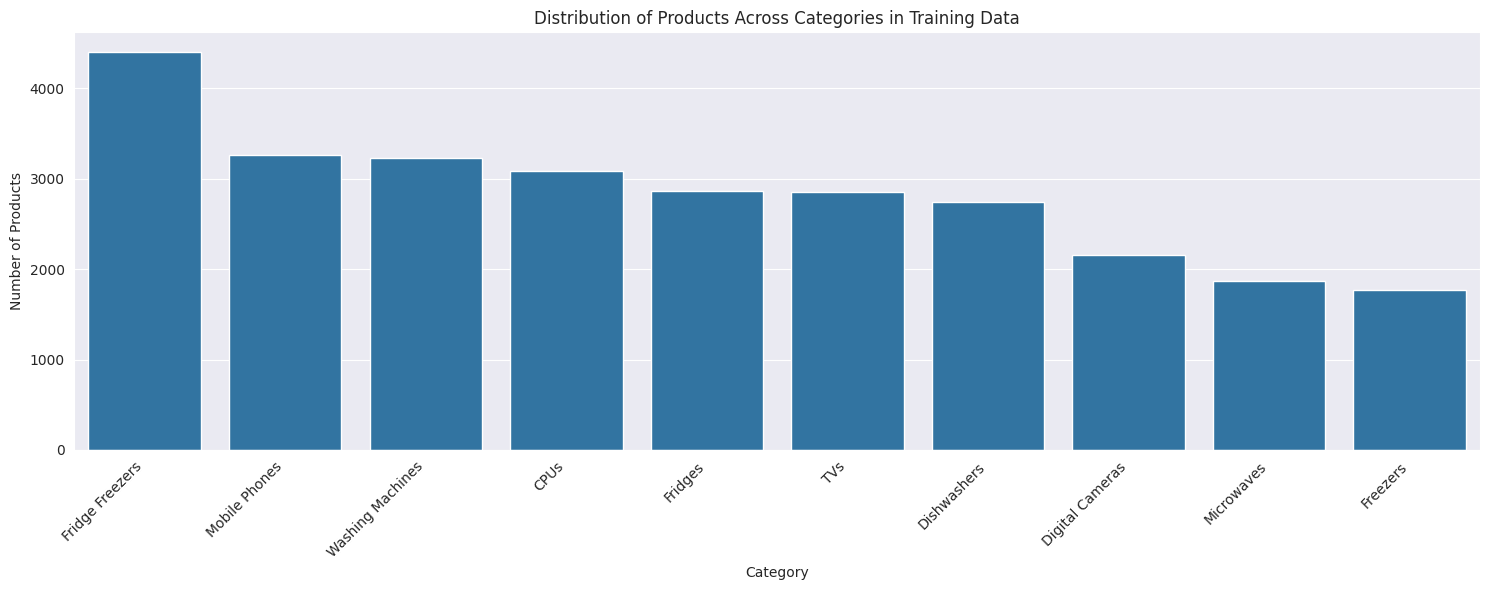
Let's examine the distribution of products across different categories in our training data.
plt.figure(figsize=(15, 6))
category_counts = train_data[target_column].value_counts()
sns.barplot(x=category_counts.index, y=category_counts.values)
plt.title("Distribution of Products Across Categories in Training Data")
plt.xlabel("Category")
plt.ylabel("Number of Products")
plt.xticks(rotation=45, ha='right')
plt.tight_layout()
plt.show()
Uploading Data to evoML
Now we'll upload our training dataset to the evoML platform for model training.
# Upload training dataset
dataset = ec.Dataset.from_pandas(train_data, name="PriceRunner Product Classification")
dataset.put()
dataset.wait()

print(f"Dataset URL: {API_URL}/platform/datasets/view/{dataset.dataset_id}")
Dataset URL: https://evoml.ai/platform/datasets/view/678d503c0992581fd1f9d52a
Running a Trial
We'll configure and run a trial to build predictive models. Since this is a multi-class classification problem, we'll optimize for ROC AUC score while using stratified validation splits to handle any class imbalance.
config = ec.TrialConfig.with_default(
    task=ec.MlTask.classification,
    budget_mode=BudgetMode.fast,
    loss_funcs=["ROC AUC"],
    dataset_id=dataset.dataset_id,
)

# Configure validation and feature generation options
config.options.enableBudgetTuning = False
config.options.validationMethodOptions = ValidationMethodOptions(
    method=ValidationMethod.holdout,
    holdoutOptions=HoldoutOptions(size=0.2, keepOrder=False),
)
config.options.featureGenerationOptions.enable = False

# Create and run the trial
trial, _ = ec.Trial.from_dataset_id(
    dataset.dataset_id,
    target_col=target_column,
    trial_name="PriceRunner Category Classification",
    config=config,
)
trial.run(timeout=900)
Results and Model Evaluation
Let's examine the performance of our models across different evaluation metrics.
# Get metrics for all models
metrics = trial.get_metrics_dataframe()
selected_metrics = metrics.loc[:, pd.IndexSlice["classification-roc", ["validation", "test"]]]
print("\nTop 5 Models by Validation ROC AUC Score:")
print(selected_metrics.sort_values(by=("classification-roc", "validation"), ascending=False))
Top 5 Models by Validation ROC AUC Score:
| Model | Validation | Test |
|---|---|---|
| lightgbm_classifier-baf47 | 0.999055 | 0.999157 |
| xgboost_classifier-a4966 | 0.998757 | 0.999080 |
| logistic_regression_classifier-368e4 | 0.998477 | 0.998324 |
| decision_tree_classifier-6a084 | 0.939458 | 0.940114 |
Final Model Evaluation
The best performing model reaches a ROC AUC score of >99.9%. Let's evaluate this model on the holdout set we created earlier.
# Get the best model
best_model = trial.get_best()
best_model.build_model()
# Make predictions on holdout data
predictions = best_model.predict(data=holdout_data)
probabilities = best_model.predict_proba(data=holdout_data)

# Create confusion matrix
confusion_matrix = pd.crosstab(
    holdout_data[target_column],
    predictions,
    normalize='index'
)

# Plot confusion matrix
plt.figure(figsize=(12, 8))
sns.heatmap(confusion_matrix, annot=True, fmt='.2%', cmap='Blues')
plt.title('Normalized Confusion Matrix on Holdout Set')
plt.xlabel('Predicted Category')
plt.ylabel('True Category')
plt.xticks(rotation=45, ha='right')
plt.yticks(rotation=0)
plt.tight_layout()
plt.show()
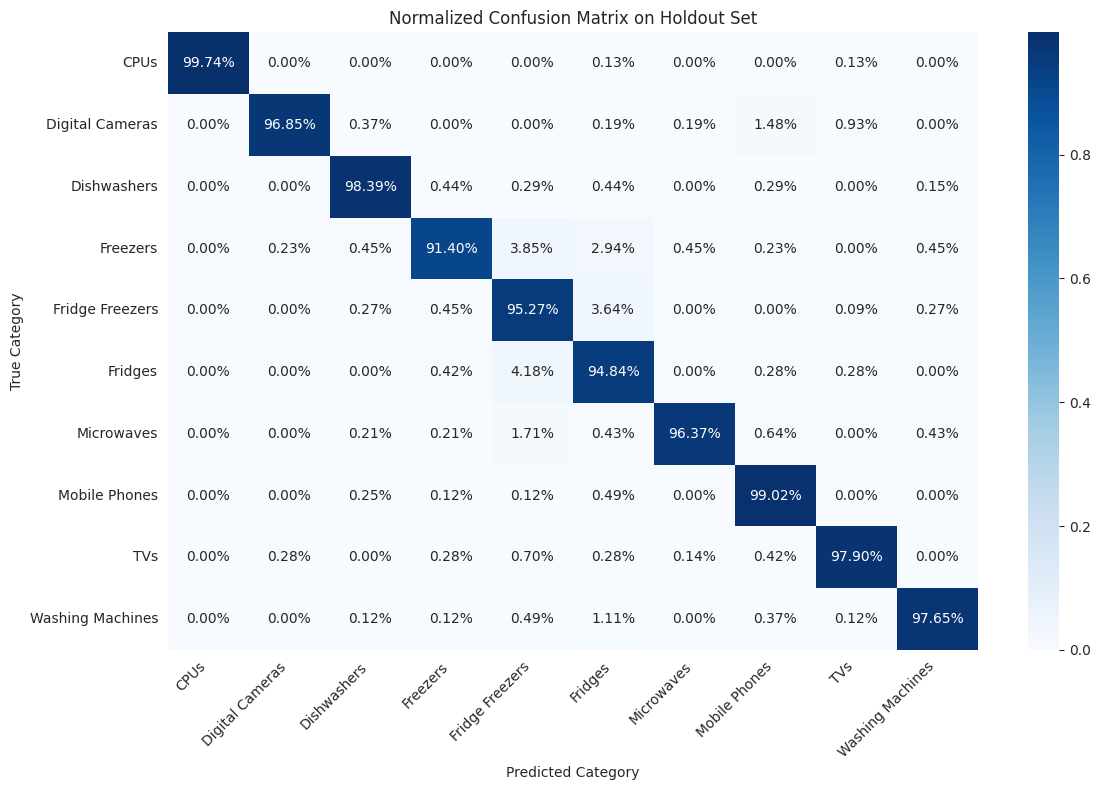
The confusion matrix shows how well our model performs across different categories. Darker colors indicate higher prediction accuracy, while lighter colors show where the model tends to make mistakes. Our model has excellent accuracy across all categories. Since the test and train sets are randomly sampled from the same overall dataset we might expect this. Generalisation to new data is the real test of the model and still it is possible to find examples which are misclassified.
Testing Edge Cases
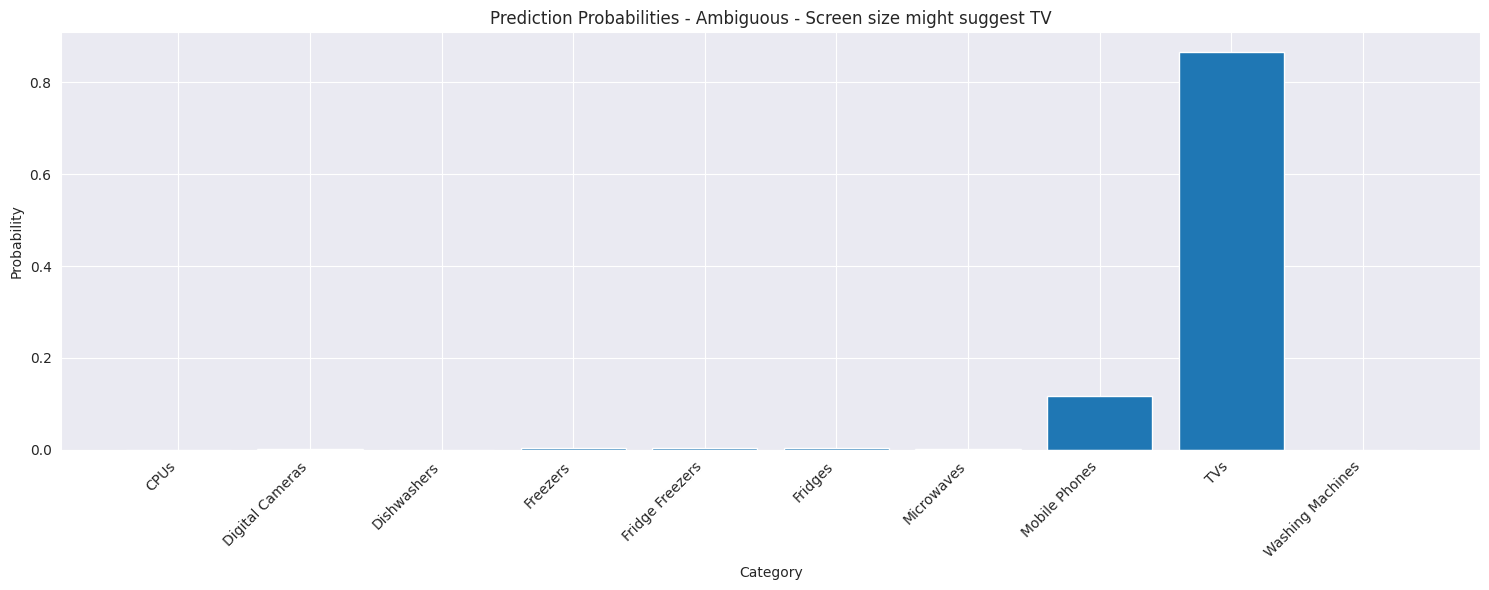
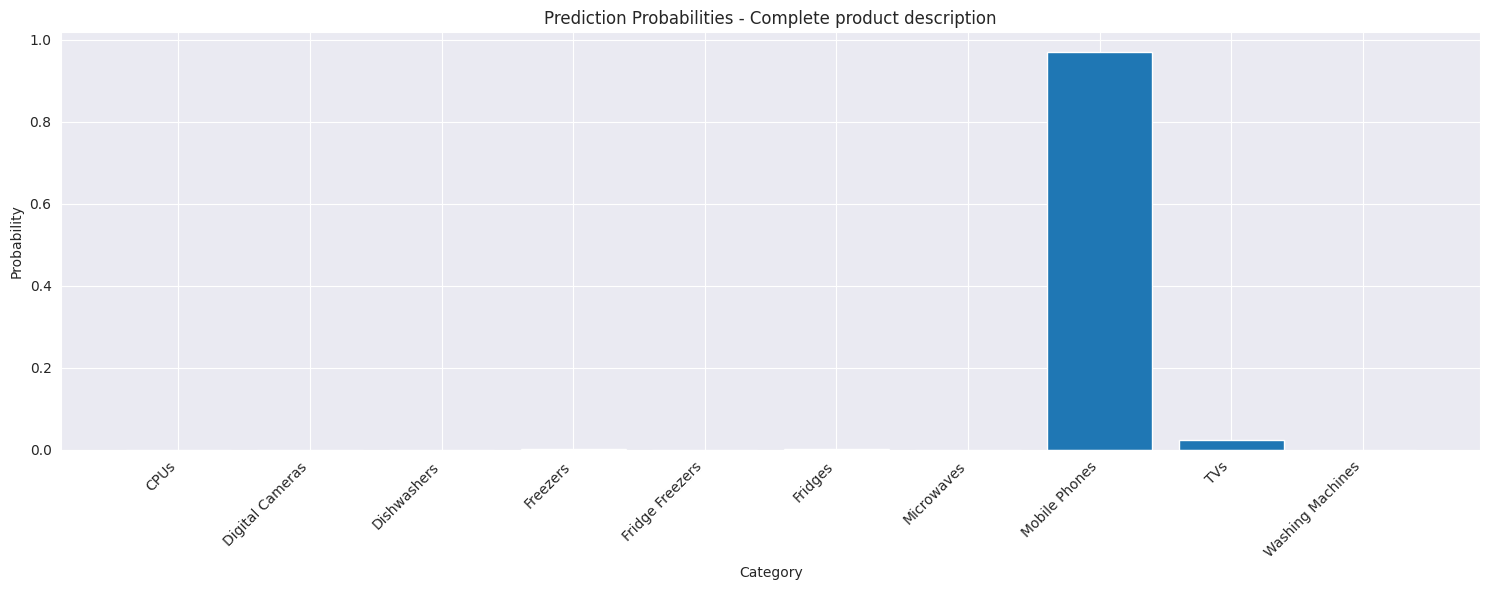
Let's examine how our model handles some challenging examples, particularly focusing on cases where product descriptions might be ambiguous or incomplete. In the example below we supply the name of mobile phone from Micromax which is incorrectly classified as a TV, likely due to the inclusion of the screen size in the product title. If this is removed the product is incorrectly classified as a fridge. Finally adding the brand name gives the correct classification.
# Function to plot prediction probabilities
def plot_prediction_probabilities(probas, title):
    categories = best_model._pipeline_handler._pipeline_information.label_mapping
    plt.figure(figsize=(15, 6))
    plt.bar(range(len(probas)), probas)
    plt.xticks(range(len(probas)), categories, rotation=45, ha='right')
    plt.title(title)
    plt.xlabel('Category')
    plt.ylabel('Probability')
    plt.tight_layout()
    plt.show()

# Test cases
test_cases = [
    ("in 2c 6.5 inch screen", "Ambiguous - Screen size might suggest TV"),
    ("in 2c", "Minimal information"),
    ("micromax in 2c 6.5 inch screen", "Complete product description")
]

for text, description in test_cases:
    example = pd.DataFrame({"Product_Title": [text]})
    probas = best_model.predict_proba(data=example)
    prediction = best_model.predict(data=example)

    print(f"\nTest Case: {description}")
    print(f"Input: {text}")
    print(f"Predicted Category: {prediction}")
    plot_prediction_probabilities(probas, f"Prediction Probabilities - {description}")
Ambiguous - Screen size might suggest TV
Input: in 2c 6.5 inch screen
Predicted Category: TVs
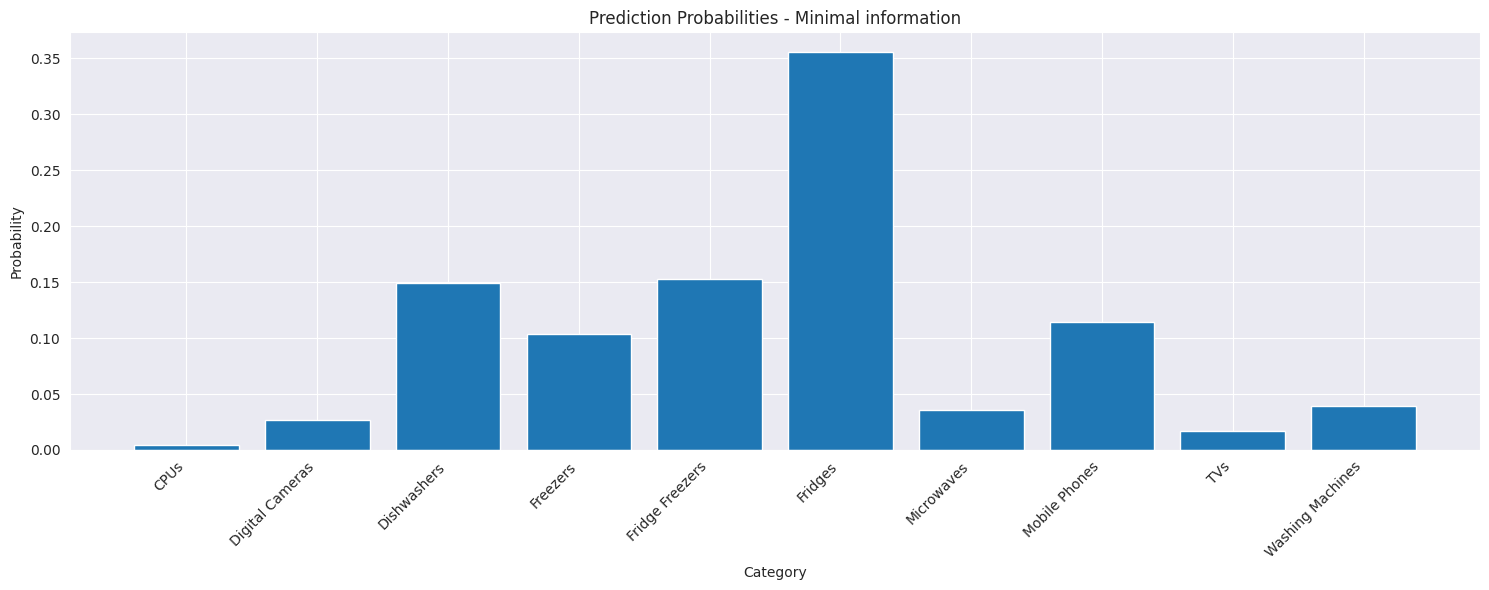
Minimal information
Input: in 2c
Predicted Category: Fridges
Complete product description
Input: micromax in 2c 6.5 inch screen
Predicted Category: Mobile Phones
Summary
In this notebook, we have:
- Trained classification models on the PriceRunner dataset using product titles
- Downloaded and built the best performing model
- Evaluated model performance using confusion matrices and probability distributions
- Demonstrated the model's behavior on edge cases with varying levels of information
The best model achieved high accuracy on the holdout set, but we've shown that it can still be sensitive to the amount and quality of information in the product title.