Probability Calibration Graph
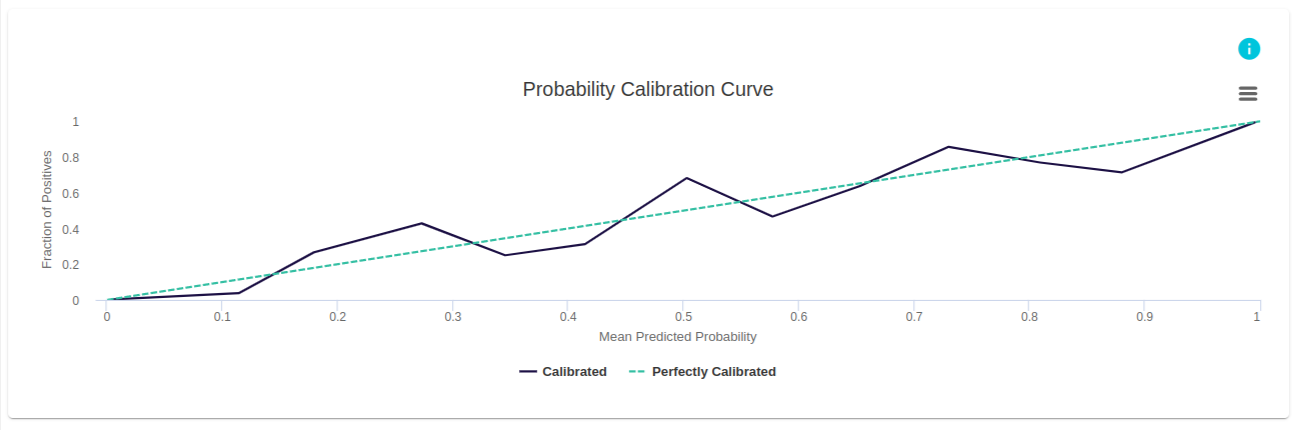
This is an example from evoML for a trial created to determine if a given website is fake.
The mean predicted probabilities for each bin are given in the x-axis. The y-axis gives the fraction of positives, or the proportion of datapoints whose class is positive, in a given bin. The fraction of positives for a perfectly calibrated classifier is given by the diagonal curve.
Some points on this curve are above the diagonal and others are below the diagonal.
Probability calibration graph
Intuition
What is a Probability calibration curve?
Probability calibration curves (also known as reliability diagrams) compare how well the probabilistic predictions of a binary classifier are calibrated. It plots the true frequency of the positive label against its predicted probability, for binned predictions. The x-axis represents the average predicted probability in each bin. The y-axis is the fraction of positives, i.e. the proportion of samples whose class is the positive class (in each bin). Finally, the results are then plotted as a line plot.

The better calibrated or more reliable a forecast, the closer the points will appear along the main diagonal from the bottom left to the top right of the plot (perfectly calibrated curve).
!!! Note
The position of the points or the curve relative to the diagonal can help to interpret the probabilities; for example:
Below the diagonal: The model has an over-forecast; the probabilities are too large. Above the diagonal: The model has an under-forecast; the probabilities are too small.
Probabilities, by definition, are continuous, so we expect some separation from the line, often shown as an S-shaped curve showing pessimistic tendencies over-forecasting low probabilities and under-forecasting high probabilities.
The calibration curve can help to understand the relative calibration of the forecasts from different predictive models.
Predicting Probabilities
A classification predictive modeling problem requires predicting or forecasting a label for a given observation. An alternative to predicting the label directly, a model may predict the probability of an observation belonging to each possible class label.
This provides some flexibility both in the way predictions are interpreted and presented (choice of threshold and prediction uncertainty) and in the way, the model is evaluated.
Although a model may be able to predict probabilities, the distribution and behavior of the probabilities may not match the expected distribution of observed probabilities in the training data. This is especially common with complex nonlinear machine learning algorithms that do not directly make probabilistic predictions and instead use approximations.
The distribution of the probabilities can be adjusted to better match the expected distribution observed in the data. This adjustment is referred to as calibration, as in the calibration of the model or the calibration of the distribution of class probabilities.
Probability Calibration
Calibration of prediction probabilities is a rescaling operation that is applied after the predictions have been made by a predictive model. Calibrated predictions may (or may not) result in an improved calibration on a probability calibration graph include logistic regression (it doesn’t need) as well as neural networks, SVM, and decision trees (usually need). There are two popular approaches to calibrating probabilities; they are Platt Scaling and Isotonic Regression.
::: Note
There are some cases where model calibration is useful:
Debugging: we want to know when our model is wrong with high confidence or assigns a low probability to the correct class
Ensembles: if we want to combine many probability models, having accurate predictions makes a difference :::
Reference: