Confusion Matrix
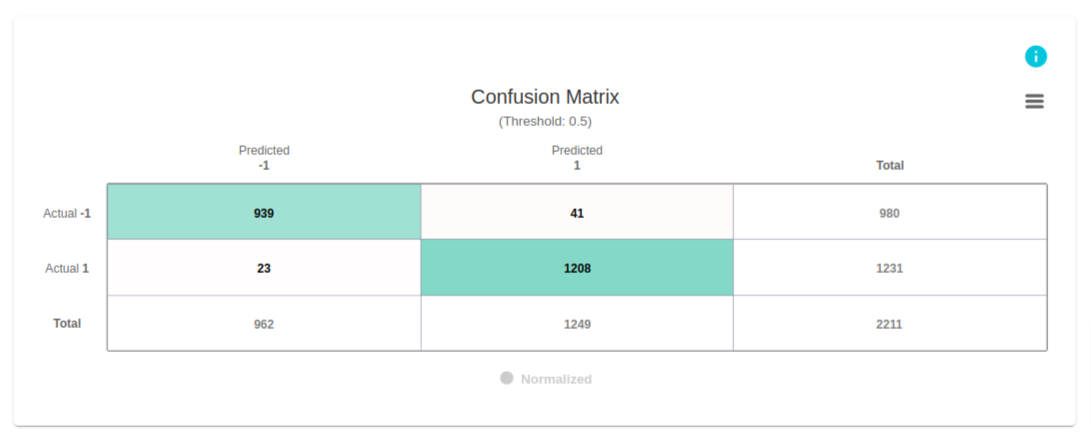
The confusion matrix shown here evaluates the performance of a model designed to classify websites as legitimate or fake. In this dataset:
- 1 denotes the website is legitimate.
- -1 denotes the website is not legitimate.
The columns represent the predicted labels, while the rows represent the actual labels. For instance, in the first row, we observe:
- 980 datapoints have the actual label of -1.
- The model correctly predicts 939 of these datapoints as -1, but incorrectly classifies 41 datapoints as 1.
In the second row:
- 1231 datapoints have the actual label of 1.
- The model accurately predicts 1208 of these as 1, while misclassifying 23 datapoints as -1.
These values from the confusion matrix can be used to calculate various metrics such as accuracy, error rate, precision, recall, true negative rate, and F1 score. However, evoML automatically generates these metrics for convenience.
Understanding Data Visualizations
Confusion Matrix
Intuition
What is a Confusion Matrix?
A confusion matrix is a performance measurement tool used in classification tasks. It measures the joint distribution of predicted and actual values of the model’s output. Below is an example confusion matrix for a binary classifier:
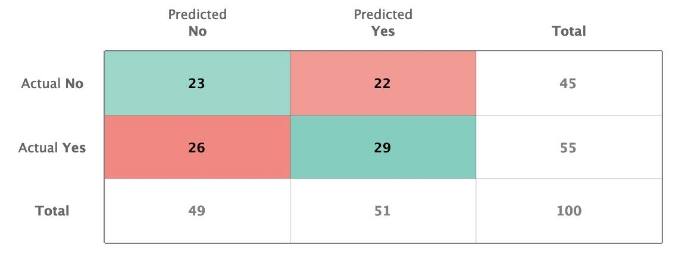
In this matrix:
- Columns contain the predicted labels.
- Rows contain the actual labels.
- The totals and error rates for each row and column are also visible.
For example, for the true label "Yes":
- The model correctly predicts "Yes" 29 times and incorrectly predicts it as "No" 26 times.
For the true label "No":
- The model correctly predicts "No" 23 times and incorrectly predicts it as "Yes" 22 times.
Terminologies and Derivations
Here are key definitions from the confusion matrix:
- True Positive (TP): Correctly predicted positive.
- True Negative (TN): Correctly predicted negative.
- False Positive (FP): Incorrectly predicted positive (Type 1 error).
- False Negative (FN): Incorrectly predicted negative (Type 2 error).
When calculating the metrics from the confusion matrix, we must define which predicted label is considered the positive class and which is non-positive. For this explanation, we assume the label "Yes" is the positive class.
A Case Study: The Boy Who Cried Wolf
Consider the classic Aesop's fable, "The Boy Who Cried Wolf", where a shepherd boy repeatedly cries "Wolf" when there is no wolf, causing the villagers to ignore him when a real wolf appears. We can model this scenario using a confusion matrix:
- Positive class: Wolf
- Negative class: No wolf
A confusion matrix summarizing the outcomes looks like this:
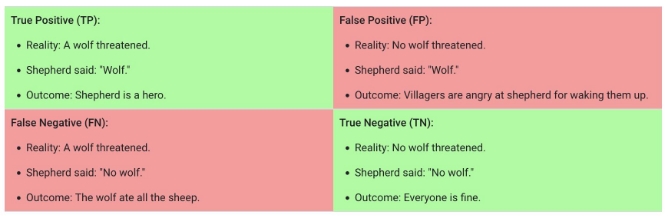
Definitions:
- True Positive (TP): The boy correctly predicts a wolf is present.
- True Negative (TN): The boy correctly predicts there is no wolf.
- False Positive (FP): The boy incorrectly predicts a wolf is present when there is none.
- False Negative (FN): The boy incorrectly predicts there is no wolf when there is one.
This scenario allows us to clearly understand how the confusion matrix reflects the model’s predictions.
Metrics for Binary Classification
From the confusion matrix, we can calculate key evaluation metrics for binary classification:
-
Accuracy: The proportion of correct predictions across both classes.
-
Error Rate: The proportion of incorrect predictions.
-
Precision (Positive Predictive Value): The proportion of true positives among all positive predictions.
-
Recall (True Positive Rate, Sensitivity): The proportion of actual positives correctly predicted.
-
F1 Score: The harmonic mean of Precision and Recall.
Defining Metrics for Multiclass Classification
In multiclass classification, we extend the confusion matrix to handle more than two classes. Here's an example:
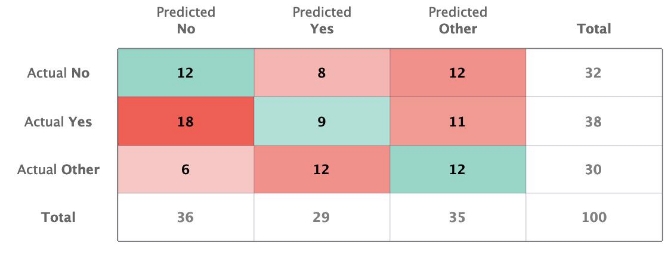
For multiclass problems:
- The positive class is defined similarly, but now includes any class of interest, with all other classes treated as "negative."
We can calculate the following:
- True Positive (TP): Correctly predicted positive class instances.
- False Positive (FP): Incorrectly predicted positive class instances.
- False Negative (FN): Instances that belong to the positive class but were incorrectly predicted as another class.
- Accuracy: Total instances where the predicted class matches the actual class divided by the total number of instances.
In multiclass classification, the True Negative (TN) metric is often less meaningful, as it does not provide useful insight for every class.